Aivia Software
Summary View
- Holger Fehlauer
- Won Yung Choi
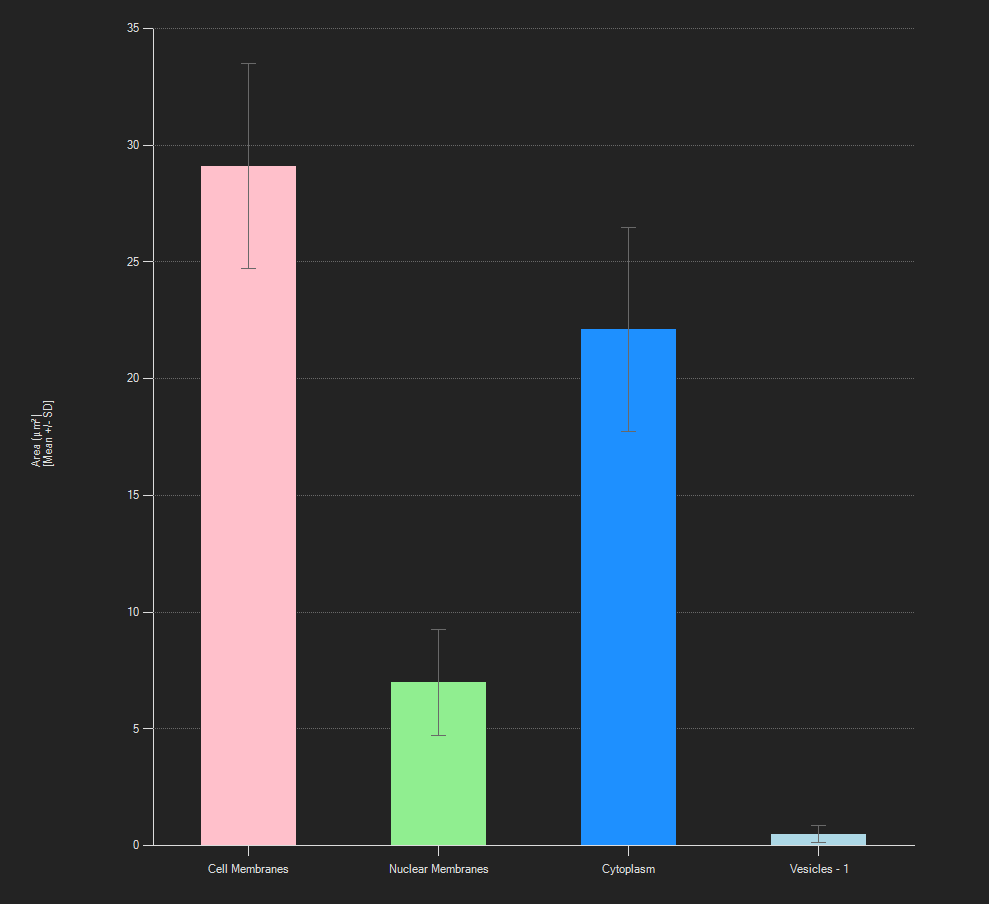
Summary View is one of the charting options available in the Charts Panel. It displays the summary measurements (mean (+/- sd or sem), min, max, total) for object set/groups as a bar graph.
To display the Summary view, open the Charts Panel and select the Summary view option  from the Charts selection dropdown menu.
On this page:
Appearance
All data for each object set/group is used to estimate mean, Standard Deviation (SD), Standard Error of the Mean (SEM), min, max or total. If mean is selected mean values are displayed as bars, SD or SEM are displayed as error bars. Min, max and total are displayed as bars, without error bars.
General usage
Select measurement
As with all charts, to select a measurement, hover over the measurement name (on the y-axis) until it turns red and then click to bring up a menu of the available measurements. Additionally, in the Summary view underneath the measurements choose the type of summary measurement (mean, min, max or total).
Select object sets/groups
To modify the object sets/groups that are displayed, hover above the object sets/groups names on the x-axis until they turn red and left click. This will bring up the menu of object sets/groups for you to select and unselect.
A plus-sign on the right of the x axis indicates additional object sets/groups which are currently not displayed. To add these object sets/groups click the plus button and select the sets/groups you want. By default, the number of object sets/groups displayed is fixed, depending on the size of the chart panel, but will be changed automatically if more object sets/groups are selected.
Context menu
If mean is displayed the context menu (right click in the chart to open it) offers the option to switch between SD and SEM for the error bar.
|
|---|
Summary view of mean +/- sd. |