Aivia Software
Annotations
- Hoyin Lai
- Holger Fehlauer
- Casey McBride
- Aiden Maloney-Bertelli (Unlicensed)
The Annotations tool provides a small set of tools designed to help you measure your image while you are in the 2D view. You can access a set of manual drawing tools for defining regions and lines on the image. The Annotations tool will measure the dimension of the drawn shape along with its intensity (if available).
Interface
The Annotations tool is one of the six tabs that are found in the Content panel on the bottom of the Aivia window. The Annotations tool interface is shown below.
|
| Annotations GUI |

There are two sections, the data table and the intensity profiler, highlighted in red and blue above respectively. Each section has its own toolbar that controls the functions related to the given section.
On this page:
Data table
The data table contains the measurement data of all manual annotations on the image. Each column represents a different measurement while each row represents a different annotation region. The data table toolbar contains a number of tools and options for interacting with the data table. The toolbar is shown below:

Description and function for each tool are summarized in the table below:
| Name | Icon | Description |
|---|---|---|
| Line tool |
| Toggles the straight line tool for measuring distance between two points |
| Freehand region tool |
| Toggles the freehand region tool for measuring the area and dimension of a drawn region |
| Rectangular ROI tool |
| Toggles the rectangular ROI tool for measuring the area and dimension of a drawn rectangle |
| Angle tool |
| Toggles the angle measurement tool for measuring the angle between two drawn segments |
| Copy selected data |
| Copies the selected row in the data table to the clipboard |
| Annotation options |
| Toggles the Annotations options pop-up |
| Display filter |
| Filters the data table display by annotation type |


Intensity profiler
Line
When you create a manual annotation using the Line tool, the Intensity Profiler section will become active and plot the intensity value on the image along the line of the first selected channel of the image.
Area (Freehand region or ROI (rectangle))
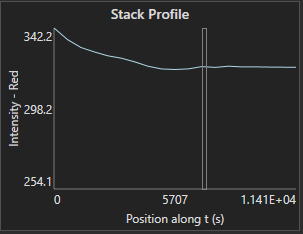
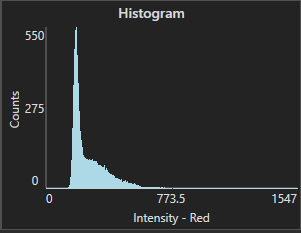
When you create a manual annotation using the Freehand region or ROI (rectangle) tool, the Intensity Profiler section will become active and plot a Histogram or (if the image is a 3D or time series) a stack profile of the intensity values on the image within the area of the first selected channel of the image.
The toolbar for the intensity profiler is shown below:
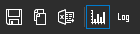
The function for each item is summarized in the table below:
| Name | Icon | Description |
|---|---|---|
| Export chart image |
| Saves the displayed intensity profiler chart as a snapshot image. |
| Copy chart image to clipboard |
| Copies the displayed intensity profiler chart as a snapshot image to the clipboard. |
| Export chart data |
| Exports the intensity profiler data to an Excel spreadsheet. |
| Switch Histogram / Stack profile (3D or time series only) |
| Switches between histogram and stack profile if stack profile is available (3D or time series only). |
| Logarithmical scale (Histogram only) |
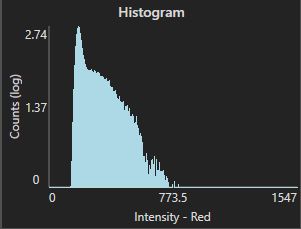
| Plots counts (y-axis) of histogram logarithmically to enhance visibility of smaller counts (Histogram only). |


Using annotations
To launch the Annotation tool, click on the Annotations  button below the image panel in Aivia. This will open the Annotations tool interface.
Draw annotations
Click on the icons on the toolbar in the Annotations panel to select the tools. There are four (4) drawing tools that corresponds to four different types of annotations:
| Annotation type | Icon | Method of interaction | Example (Click to expand) |
|---|---|---|---|
| Line |
| Left-click on the image once to define the start of the line; move your cursor and click on the image again to define the end point |
|
| Freehand region |
| Hold down the left mouse button while moving your cursor to trace the desired region; to finish the region, release the mouse button |
|
| Rectangular ROI |
| Left-click on the image once to define the starting coordinate of the ROI; move your cursor and click on the image again to define the opposing coordinates |
|
| Angle |
| Left-click on the image once to define the start of the first segment; move your cursor and click on the image again to define the end point of the first segment; move your cursor again and click on the image for a third time to define the end point of the second segment. |
|
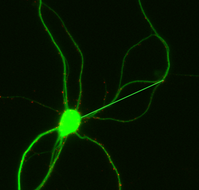

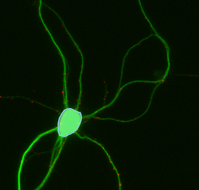
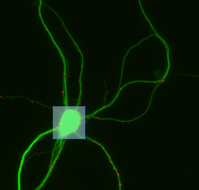
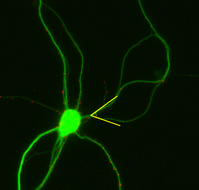
The drawn annotations will be overlaid on the image and show across all time frames of an image sequence. The annotations will be overlaid on the image when you export the image to snapshot or to a movie.
View measurements
A new entry will be added to the Annotations data table along with the relevant measurements for the selected annotations type. In the data table, multiple measurements are shown at once. The list of available measurements by annotation type is summarized in a table in the next section.
When you hover the mouse cursor over the drawn annotations, a tooltip appears with measurement for the given annotation type (see right). The tooltip measurement shown are as follows:
- Line: length
- Freehand region: area
- Rectangular ROI: area
- Angle: angle (in degrees)
Select annotations
After drawing an annotation manually, it will be selected automatically on the image as well as in the data table in the Annotations panel. To select another annotation, click on the display overlay on the image or on the desired row in the table. You can select multiple annotations by holding down the Shift or Ctrl key while left-clicking on the annotations.
The selected annotation will be highlighted with a thicker and brighter outline. For freehand regions and rectangular ROIs, a bounding box is also displayed allowing you to adjust the size of the region by dragging the anchors on the bounding box.
Delete annotations
You can delete an annotation by selecting the annotation you wish to remove and press the Delete key on your keyboard or clicking the Remove annotations  icon in the data table.
Alternately, you can delete the annotation by right-clicking on the annotation and selecting the Remove annotation option in the context menu (see below).
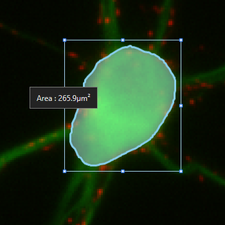 |
| Annotations tooltip and bounding box |
Context menu options
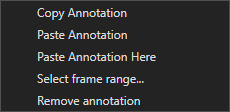
When you right-click on a drawn annotation, a context menu appears next to your mouse cursor (see right). The context menu has five (5) options and their functions are summarized below:
| Option | Function description |
|---|---|
| Copy annotation | Copies the selected annotations to clipboard |
| Paste annotation | Pastes the copied annotation in the clipboard at the origin (upper left corner) of the image |
| Past annotation here | Pastes the copied annotation in the clipboard at the position of the cursor |
| Select frame range | Opens the select copy range dialog (see below) that lets you specify the time frame for the overlay to be shown
|
| Remove annotation | Deletes the selected annotation from the image and the data table |
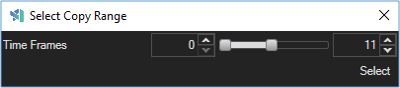
|
| Annotations context menu |
Using intensity profiler
The intensity profiler is located to the right of the annotation data table. The tool lets you view the intensity changes along a drawn segment on the image, along a stack (3D or time series) or the histogram of counts vs intensity.
Line Profile
When you manually draw an annotation using the line tool, the intensity profiler display will refresh automatically to show the intensity profile along the drawn segment (see right).
If you have more than one line annotation drawn on the image, you can select a different line profile to display by clicking on the segment on the image or selecting the annotation in the data table. The intensity profiler display will refresh automatically to show the intensity trace of the selected line.
Adjust measurement radius
You can include additional pixels adjacent to the drawn line for plotting the intensity profile by changing the Line measurement radius option in Annotation options (see below). The line profiler will include extra pixels on either side of the drawn line specified by the value and average their intensities to update the plot.
Stack Profile (3D or time series only)
When you manually draw an annotation using the Freehand or ROI (rectangle) tool on a 3D image or a time series, the intensity profiler display will refresh automatically to show the intensity profile along the stack within the drawn area (see right). A bar within the chart will show you the position of the currently selected image within the stack.
Histogram
When you manually draw an annotation using the Freehand or ROI (rectangle) tool, the intensity profiler display will refresh automatically to show the intensity histogram within the drawn area (see right). You may switch between logarithmical and regular scaling of the y-axis (counts) to enhance visibility of lower counts.
If you have more than one area annotation drawn on the image, you can select a different stack profile or histogram to display by clicking on the segment on the image or selecting the annotation in the data table. The intensity profiler display will refresh automatically to show the intensity trace / histogram of the selected area.
Export intensity profile
The toolbar above the intensity profiler lets you save and export the displayed intensity profile chart as an image or as raw data.
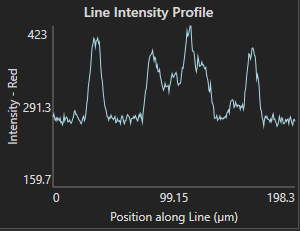 |
| Line profile |
|
Stack profile (bar indicating position within the stack) |
|
| Histogram (normal and logarithmical) |
Annotation options
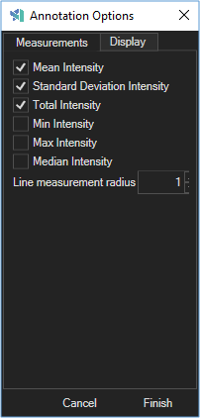
Annotation options window gives you the ability to customize the display of the annotations. You can launch the window by clicking on the Options  icon (see below, right). The dialog has two tabs which allows you to control different aspects of the annotation display, they are:
- Measurements tab lets you add intensity measurements to the annotations data table
- Display tab lets you customize the color of the annotations
To confirm the changes you have made and to close the Annotations Options window, click Finish; or to close the window without updating, click Cancel.
Measurements
You can add intensity measurements to the data table using the Annotation Options dialog by clicking on the checkbox next to the name of the intensity measurement.
The measurements that are available for each annotation type are summarized in the table below:
| Measurement name | Line | Freehand region | Rectangular ROI | Angle |
|---|---|---|---|---|
| Length |  |  | | |
| Height | | | | |
| Width | | | | |
| Area | | | | |
| Centroid (X, Y) | | | | |
| Angle | | | | |
| Mean intensity | | | | |
| Standard Deviation of intensity | | | | |
| Total intensity | | | | |
| Min intensity | | | | |
| Max intensity | | | | |
| Median intensity | | | | |
For line measurements, you can include additional adjacent pixels for calculating the intensity measurements by specifying the Line measurement radius value in the Annotation options dialog.
|
| Annotations options (Measurements tab) |
Display
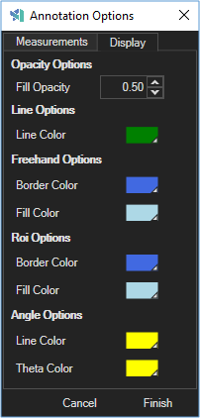
In the Display tab of Annotation options, you can customize the color of the annotations (see right). To change the color, click on the color box associated with the option you wish to change. This will bring up the color picker which will allow you to choose from a standard palette of available colors. Click Finish to confirm your changes and close the Annotation options window.
The display options are grouped by annotation types and changing the option will apply the color changes to all annotations of the same type. The options are as follows:
| Option name | Annotation types affected | Descriptions |
|---|---|---|
| Fill opacity | Freehand region, rectangular ROI | Adjusts the opacity of the filled region, with 0 being fully opaque and 1 being fully transparent |
| Line color | Line, angle | Specifies the color of the straight line segments of the affected annotations |
| Border color | Freehand region, rectangular ROI | Specifies the color of the border, or edge of the regions |
| Fill color | Freehand region, rectangular ROI | Specifies the color of the fill in the region, the actual color reproduction may be different depending on the fill opacity chosen |
| Theta color | Angle | Specifies the color of the angle display between the segments |
|
| Annotation options (Display tab) |