Aivia Software
Track display
- Hoyin Lai
- Aiden Maloney-Bertelli (Unlicensed)
Tracks are objects that are linked over time; tracks contain information about an object's positions throughout its lifetime. Track objects can be generated by applying one of the tracking recipes available in Aivia. Tracks have four (4) different types of overlays that can be toggled individually.
This page covers display options that are specific to tracks. General information on displaying object sets can be found on the Object Settings page.
Interface
An example of how object groups that are of the track type appear in the Object Set Settings panel is shown below.
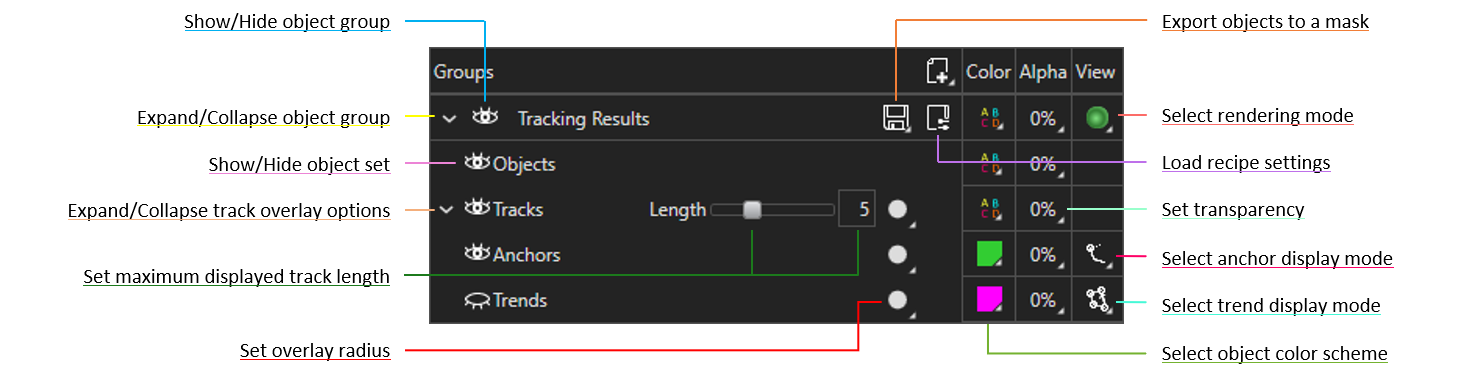
The option to select a rendering mode in the View column is only available for tracks with 3D objects. 2D tracks also do not have the Alpha column.
On this page:
| Overlay | Objects | Tracks | Anchors | Trends | Combined |
|---|---|---|---|---|---|
| 2D | 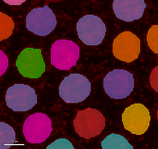 | 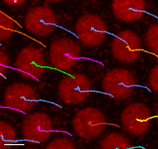 | 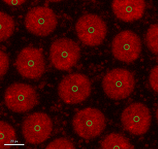 | 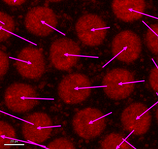 | 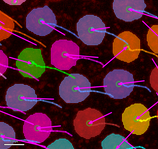 |
| 3D | 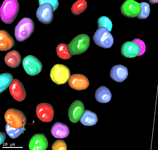 | 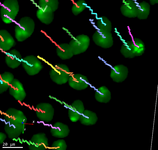 | 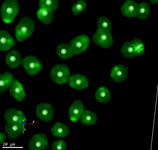 | 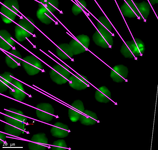 | 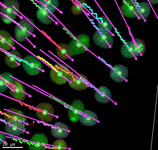 |
Object display
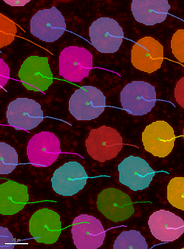
Tracks in Aivia are associated with objects that are related in time. Objects can be either outlines (in 2D) or meshes (in 3D). Objects are visible only in their respective views, depending on whether the dataset is 2D or 3D. Below are examples of how objects are displayed (along with tracks and anchors) for 2D and 3D datasets.
|
|
| Objects in 2D | Objects in 3D |
Rendering modes
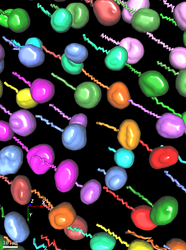
If you have 3D objects tracked over time, you can specify the rendering mode for the object meshes in 3D View by clicking on the icon in the View column for the object group and then selecting the mode from the menu that opens. There are three (3) rendering modes for meshes:
| Rendering Mode | Icon | Description |
|---|---|---|
| Solid Surface |
| Renders meshes as solid, closed surfaces |
| Wireframe |
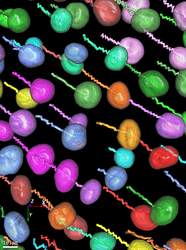
| Renders meshes as sets of connected line segments |
| Points |
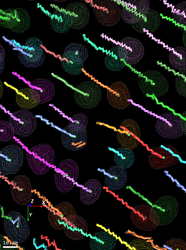
| Renders meshes as point clouds |


Once a new rendering mode is selected, the displayed object sets are refreshed automatically to reflect the new selection.
Depending on your hardware, the size of the image, and the rendering mode chosen, it may take Aivia up to several minutes to fully render the display with the specified settings.
A comparison between the three (3) rendering-mode displays is shown below (click on an image to enlarge it).
|
|
|
| Solid Surface | Wireframe | Points |
|
| Rendering-mode options |

Track display
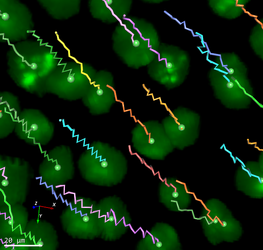
A track is a line representation of an object's position over time. As you progress to the next time point, a short segment is appended to the display, indicating the movement of the object from its previous position to its new position on the current frame. Options for track display are given in the table below.
| Name | Icon | Description |
|---|---|---|
| Set Track Length |
| Specifies the number of frames to display with the track overlay; a longer track length may result in reduced performance |
| Set Overlay Radius |
| Specifies the width of the track display |
| Show/Hide Track Labels |
| Shows/Hides track labels in Main View (2D) |


You can drag the Set Track Length slider or use the adjacent textbox to adjust the maximum number of frames included in the track display.
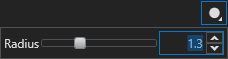
When you click on the Set Overlay Radius icon, a slider and textbox pop up underneath the icon. You can use the slider, textbox, or up and down arrows to adjust the radius. Press Enter to confirm changes made in the textbox. It make take a short amount of time for the track display to update, depending on the number of tracks that are visible on the image.
Anchor display
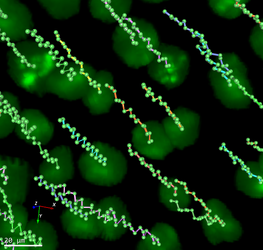
Anchors show the position of the tracked object's centroid. The anchor display is updated each time when you progress to another time point. There are two (2) adjustments that are available for anchor display:
| Name | Icon | Description |
|---|---|---|
| Set Overlay Radius |
| Specifies the radius of the anchor display |
| Select Anchor Display Mode |
| Specifies the display style of the anchor overlay |

Same as the tracks display, you can adjust the radiusof the anchor circle (2D) or sphere (3D) by clicking on the Set Overlay Radius icon and using the sliders to specify a value.
In the View column, there are two (2) options for anchor displays:
| Name | Icon | Description | Example (Click to enlarge) |
|---|---|---|---|
Current (Default) |
| Shows an anchor only for the current track position |
|
| All |
| Shows all anchors on the displayed portion of the track |
|


Trend display
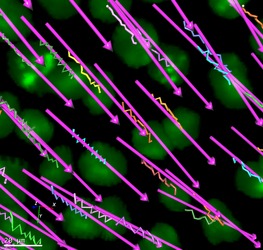
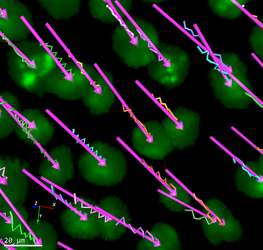
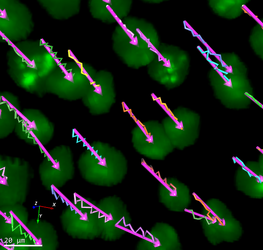
Trends show the general directions the tracks travel. Trends are displayed as arrows pointing from the initial position to the terminal position (depending on trend display mode). Trends are updated when you progress to the next time point. There are two (2) adjustments that are available for trend display:
| Name | Icon | Description |
|---|---|---|
| Set Overlay Radius |
| Specifies the width of the trend arrow |
| Set Trend Display Mode |
| Specifies the trend display mode |

Same as the tracks display, you can adjust the size and thickness of the trend arrow by clicking on the Set Overlay Radius icon and using the sliders to specify a value.
In the View column, there are three (3) options for trend displays:
| Name | Icon | Description | Example (click to enlarge) |
|---|---|---|---|
Full Track (Default) |
| Shows the trend from the track's initial position to its terminal position |
|
| First To Current |
| Shows the trend from the track's initial position to its current position |
|
| Only Visible |
| Shows the trend from the track's position at the earliest displayed time point to its current position |
|



Coloring options
You can specify the coloring mode for each track overlay separately. The coloring scheme for an overlay can be specified by clicking on the icon in the Color column for the overlay. The coloring options for track overlay displays are summarized in the table below:
| Coloring Mode | Objects | Tracks | Anchors | Trends |
|---|---|---|---|---|
| Solid Color |  |
| | |
| Color By Label |
|  | | |
| Color By Object Type | | | | |
| Color By Name | | | | |
| Color By Measurement | | | | |
| Color By Class | | | | |
| Color By Cell | | | | |