Aivia Software
Spreadsheet
- Hoyin Lai
- Casey McBride
The Spreadsheet is the main method of viewing analysis data generated by Aivia. The spreadsheet collects the measurement values of all objects on the image and displays them in a sortable table. Selection in the spreadsheet is linked to the image panel and charts, allowing you to highlight objects of interests based on the analysis results.
Interface
The Spreadsheet is one of the six tabs that are found in the Content panel on the bottom of the Aivia window. An example of the Spreadsheet interface is shown below:
|
| Spreadsheet GUI |
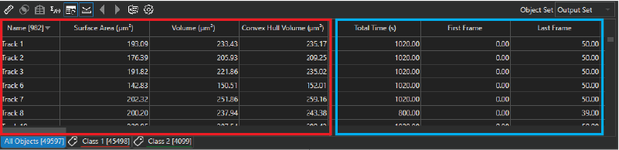
There are two sections: the toolbar and the data table. The data table is further subdivided into two sections, as highlighted in red and blue above for object instantaneous and temporal summary measurements respectively. You can adjust the width of the data table sections by dragging the separator between the sections.
Toolbar
The Spreadsheet toolbar contains a number of tools and options for interacting with the data table. The spreadsheet toolbar is shown below:

Description and function for each tool are summarized in the table below:
| Name | Icon | Description |
|---|---|---|
| Measurement tool |  | Opens the Measurement Tool dialog |
| Relations tool |
| Opens the Relations Tool dialog |
| Gate selected object |
| Gate selected object into a new subset |
| Show summary panel |
| Toggle display of summary panel below the data table |
| Auto-refresh columns |
| Automatically refresh measurement values in the spreadsheet when progressing to a different time point when eabled |
| Auto-scroll to selected |
| Automatically scroll to row of the most recently-selected object when enabled |
| Go to previous / next selected |
| Go to the previous or next select object row in the spreadsheet |
| Export data to Excel |
| Opens the Export to Excel window for saving spreadsheet data to Excel |
| Spreadsheet options |
| Opens the spreadsheet options dialog |


On the right side opposite to the toolbar is the Object Set selector which allows you to display the measurements generated on a different object set on the image.
Data table
The data table contains the measurement data of all objects on the image. Each column represents a different measurement while each row represents a different object. The data table is split into two sections (see above)
- Instantaneous measurements are displayed on the left side of the data table and contains data about each object at the currently-displayed time point
- Temporal summary measurements are displayed on the right side of the data table and contains data about each object summarized over its entire lifetime
You can adjust the relative width of the two sections by dragging the separator between the sections.
Tabs across the bottom of the data table organizes the spreadsheet display into multiple pages. Each page includes different data on the given object set. Summary measurements over the entire image, as well as classification output and gated objects, can be viewed by clicking on the relevant tab. The tab also includes a count of all objects that are visible or displayed in the data table.
Using the spreadsheet
To launch the Spreadsheet, click on the Spreadsheet  button below the image panel in Aivia. This will open the Spreadsheet interface.
Select measurements
Measurements that are generated by Aivia (through applying a recipe) are shown in the Spreadsheet. You can add or modify the list of measurements by clicking on the Measurement Tool icon on the toolbar to open the Measurement window.
Instructions on how to add additional measurements to your analysis can be found in the How to add measurements to analysis results page.
Select objects
Each row in the data table represents a single object on the image. Clicking on a row will select the object in the Spreadsheet, Charts and on the image. You can select multiple objects on the image by holding down the Ctrl or Shift key during selection.
To navigate between selections, click on the backward or forward arrows 
 to navigate to the previous and next selected object respectively. If you have auto-scroll to selected
  enabled on the Spreadsheet toolbar, Aivia will automatically navigate to the row of the most recently-selected object in the Spreadsheet.
Gate objects
After selection, you can create a subset containing just the selected objects by pressing the Gate  button on the Spreadsheet toolbar. A new tab will be created at the bottom of the spreadsheet containing the subset of objects that were gated out. The gated objects will be shown in both the subset tab and the All Objects tab.
On this page:
Sort columns
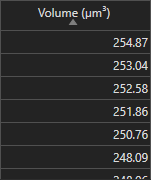
You can sort the spreadsheet by any measurement as well as the name by clicking on the header of the table on the column you wish to sort by. When you click on the column header, a small indicator shows you the column that the Spreadsheet is being sorted by (see right).
Sort by descending value is indicated by a triangle pointing upward. To sort by ascending value, click on the column header again and the symbol will change to a triangle pointing downward.
Show summary
You can get statistical measurements of all measurements on a single time point by clicking the Show summary panel  button on the Spreadsheet toolbar. This will open a new panel at the bottom of the data table above the subset tabs, as shown below:
|
| Spreadsheet GUI with summary panel shown |
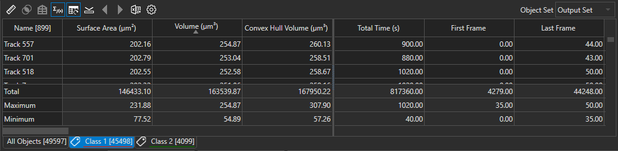
Statistics for each measurements are calculated for all objects that are displayed on the given frame. You can specify the statistic (total, maximum, minimum, average, mode and standard deviation) to calculate in the Spreadsheet options.
Export spreadsheet
You can export the spreadsheet data by clicking on the Export to Excel  button on the Spreadsheet toolbar. Details on how to export the spreadsheet data can be found on the Export data to Excel page.
|
| Sorted column (descending value) |
Show other object sets
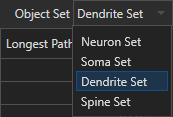
If there are more than one object set on the image, you can change the object set to display the other object sets by clicking on the Object Sets dropdown menu located in the upper right corner of the Spreadsheet panel above the data table.
When you click on the dropdown menu, you will be presented with a list of the object sets that are on this image. Click on another object set and the spreadsheet will automatically refresh to show the data for the selected object set.
|
| Object set selector |
Spreadsheet options
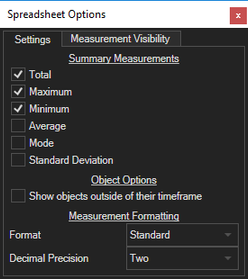
When you click on the Spreadsheet Options  button on the toolbar, the Spreadsheet options dialog is opened, as shown on the right. There are two tabs in the dialog:
- Settings tab lets you adjust the general display options in the Spreadsheet
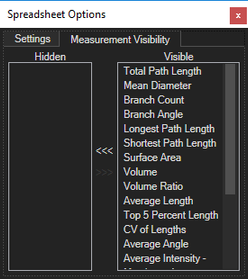
- Measurement visibility tab lets you show or hide measurements from the Spreadsheet
Settings
Use the checkbox or dropdown menu to select the desired configuration in the Settings tab. There are three (3) sections:
- Summary measurements let you specify the statistic to calculate when the Summary panel is shown
- Object options let you specify the display of objects that are not shown on the current timeframe
- Measurement formatting let you specify the display format of the measurements
Description for each option is summarized in the table below:
| Section | Name | Description |
|---|---|---|
| Summary measurements | Total | Calculates the sum (or total) of all objects for a given measurement |
| Maximum | Finds the maximum value for a given measurement | |
| Minimum | Finds the minimum value for a given measurement | |
| Average | Calculates the mean (or average) of all objects for a given measurement | |
| Mode | Finds the most common value for a given measurement | |
| Standard Deviation | Calculates the standard deviation of all objects for a given measurement | |
| Object options | Show objects outside of their timeframe | When enabled, all objects, including ones that are not shown on the current timeframe, will be displayed in the spreadsheet |
| Measurement formatting | Format | Specifies the number format displayed in the Spreadsheet, there are two options:
|
| Decimal precision | Specifies the number of digits shown after the decimal point up to 5 decimal places (Default is 2) |
Close the Spreadsheet options dialog to confirm the changes and update the Spreadsheet.
|
Spreadsheet options dialog (Settings tab) |
Measurement visibility
In this tab, you can select the measurements to show in the Spreadsheet. The list of all visible measurements are shown on the right. To hide a measurement, select from the Visible list and click the <<< button to move it to the Hidden list. To show a measurement, select from the Hidden list and click the >>> button to move it to the Visible list. You can select multiple measurements at once by holding down Ctrl or Shift key during selection.
Close the Spreadsheet options dialog to confirm the changes and update the Spreadsheet.
While a measurement is put into the Hidden list, it will not be displayed in the Spreadsheet. The measurement is still available in Aivia for other uses such as export, classification and advanced measurements. To remove a measurement from an object set, use the Measurement Tool and de-select the measurement there.
|
Spreadsheet options dialog (Measurement Visibility tab) |