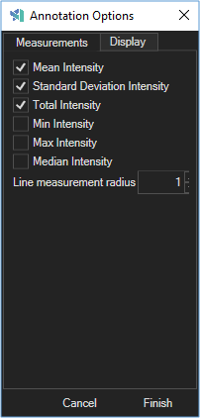
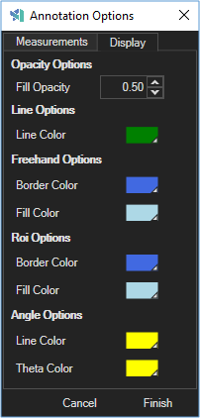
The Annotations tool provides a small set of tools designed to help you measure your image while you are in the 2D view. You can access a set of manual drawing tools for defining regions and lines on the image. The Annotations tool will measure the dimension of the drawn shape along with its intensity (if available).
Interface
The Annotations tool is one of the six tabs that are found in the Content panel on the bottom of the Aivia window. The Annotations tool interface is shown below.
There are two sections, the data table and the line profiler, highlighted in red and blue above respectively. Each section has its own toolbar that controls the functions related to the given section.
| Panel | ||||||
|---|---|---|---|---|---|---|
On this page:
|
Data table
The data table contains the measurement data of all manual annotations on the image. Each column represents a different measurement while each row represents a different annotation region. The data table toolbar contains a number of tools and options for interacting with the data table. The toolbar is shown below:
Description and function for each tool are summarized in the table below:
Line profiler
When you create a manual annotation using the Line tool, the Line Profiler section will become active and plot the intensity value on the image along the line on the first channel on the image. The toolbar for the line profiler is shown below:
The function for each item is summarized in the table below:
Using annotations
To launch the Annotation tool, click on the Annotations button below the image panel in Aivia. This will open the Annotations tool interface.
Draw annotations
Click on the icons on the toolbar in the Annotations panel to select the tools. There are four (4) drawing tools that corresponds to four different types of annotations:
The drawn annotations will be overlaid on the image and show across all time frames of an image sequence. The annotations will be overlaid on the image when you export the image to snapshot or to a movie.
View measurements
A new entry will be added to the Annotations data table along with the relevant measurements for the selected annotations type. In the data table, multiple measurements are shown at once. The list of available measurements by annotation type is summarized in a table in the next section.
When you hover the mouse cursor over the drawn annotations, a tooltip appears with measurement for the given annotation type (see right). The tooltip measurement shown are as follows:
- Line: length
- Freehand region: area
- Rectangular ROI: area
- Angle: angle (in degrees)
Select annotations
After drawing an annotation manually, it will be selected automatically on the image as well as in the data table in the Annotations panel. To select another annotation, click on the display overlay on the image or on the desired row in the table. You can select multiple annotations by holding down the Shift or Ctrl key while left-clicking on the annotations.
The selected annotation will be highlighted with a thicker and brighter outline. For freehand regions and rectangular ROIs, a bounding box is also displayed allowing you to adjust the size of the region by dragging the anchors on the bounding box.
Delete annotations
You can delete an annotation by selecting the annotation you wish to remove and press the Delete key on your keyboard or clicking the Remove annotations icon in the data table.
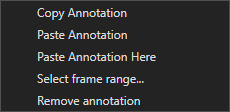
Alternately, you can delete the annotation by right-clicking on the annotation and selecting the Remove annotation option in the context menu (see below).
Context menu options
When you right-click on a drawn annotation, a context menu appears next to your mouse cursor (see right). The context menu has five (5) options and their functions are summarized below:
Opens the select copy range dialog (see below) that lets you specify the time frame for the overlay to be shown
Filter display
You can filter the annotation data table by types of annotations by clicking on the dropdown menu next to Filter in the toolbar and selecting the annotations you wish to see. There are six (6) filter options:
- All show all annotation types in the data table
- Lines show only line annotations
- Freehands show only freehand region annotations
- ROIs show only rectangular ROI region annotations
- Angles show only angle annotations
- Regions show region-based annotations, or both freehand regions and rectangular ROI regions.
The table refreshes automatically to display only the specified type and hide all others. The annotation overlay on the image is not affected by this option.
Using line profiler
The line profiler is located to the right of the annotation data table. The tool lets you view the intensity changes along a drawn segment on the image.
When you manually draw an annotation using the line tool, the line profiler display will refresh automatically to show the intensity profile along the drawn segment (see right).
If you have more than one lineDraw annotations
Click on the icons on the toolbar in the Annotations panel to select the tools. There are four (4) drawing tools that corresponds to four different types of annotations:
| Annotation type | Icon | Method of interaction | Example (Click to expand) |
|---|---|---|---|
| Line | Left-click on the image once to define the start of the line; move your cursor and click on the image again to define the end point | ||
| Freehand region | Hold down the left mouse button while moving your cursor to trace the desired region; to finish the region, release the mouse button | ||
| Rectangular ROI | Left-click on the image once to define the starting coordinate of the ROI; move your cursor and click on the image again to define the opposing coordinates | ||
| Angle | Left-click on the image once to define the start of the first segment; move your cursor and click on the image again to define the end point of the first segment; move your cursor again and click on the image for a third time to define the end point of the second segment. |
The drawn annotations will be overlaid on the image and show across all time frames of an image sequence. The annotations will be overlaid on the image when you export the image to snapshot or to a movie.
Related articles
| Filter by label (Content by label) | ||||||||||||||||||
|---|---|---|---|---|---|---|---|---|---|---|---|---|---|---|---|---|---|---|
|
| Page Properties | ||
|---|---|---|
| ||
|


